How to Use IP SLA Features to Troubleshoot Your Network
Table of Contents
- What is IP SLA? ‹
- ICMP Echo reaction-configuration ‹
- IP SLA FTP configuration ‹
- IP SLA TCP-Connect configuration ‹
- IP SLA UDP-Jitter configuration ‹
- IP SLA HTTP Get configuration ‹
- IP SLA DNS configuration ‹
- Download section ‹
What is IP SLA?
An IP SLA can send and monitor different types of network traffic at regular intervals. For example, an IP SLA can test a TCP or UDP port, confirm the availability of a file via FTP, or measure the network delay to a specific IP destination address. Automated actions can be triggered based on the results of an IP SLA. If an IP SLA shows the state of a WAN link is down, this can trigger a failover mechanism.
A frequently used type of IP SLA is called the ICMP Echo IP SLA. It can be configured with a variety of options. For example, the following configuration instructs R1 to send a ping request to the IP address 10.2.0.2 using the vrf TEST-VRF. Also, the ping request uses the Type of Service (ToS) value 184 which translates to the QoS DSCP marking for the Expedited Forwarding (EF) class.
R1>
R1>enable
R1#configure terminal
Enter configuration commands, one per line.  End with CNTL/Z.
R1(config)#
R1(config)#ip sla 10
R1(config-ip-sla)#icmp-echo 10.0.0.2
R1(config-ip-sla-echo)#tos 184
R1(config-ip-sla-echo)#vrf TEST-VRF
R1(config-ip-sla-echo)#threshold 1000
R1(config-ip-sla-echo)#timeout 1000
R1(config-ip-sla-echo)#frequency 1
R1(config-ip-sla-echo)#
R1(config-ip-sla-echo)#exit
R1(config)#
R1(config)#
R1(config)#ip sla schedule 10 life forever start-time now
R1(config)#
R1(config)#
R1(config)#exit
R1#
R1#
R1#show ip sla statistics
IPSLAs Latest Operation Statistics

IPSLA operation id: 10
        Latest RTT: 1 milliseconds
Latest operation start time: 08:27:08 UTC Mon May 12 2025
Latest operation return code: OK
Number of successes: 13
Number of failures: 0
Operation time to live: Forever
Real-time latency sensitive traffic (such as VoIP calls) are commonly assigned to the EF class. The below capture shows the type of packet that is sent by the above configured IP SLA. It is visible that the DSCP field is set to Expedited Forwarding.
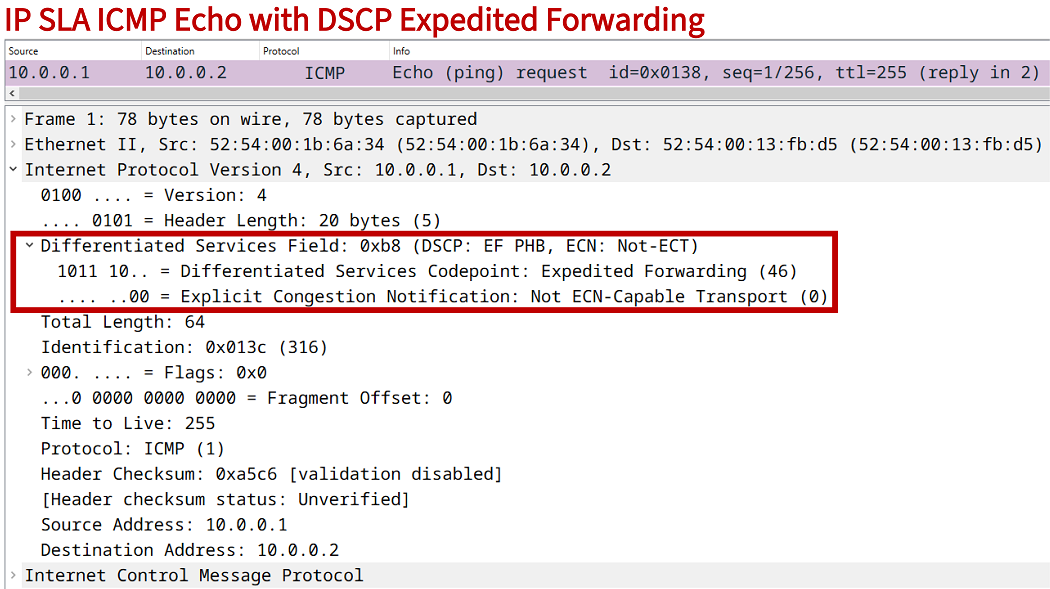
A use case of such a test is to verify whether the QoS marking/shaping/policing configuration for the EF class is correctly applied to interfaces by checking whether policy-map counters are incremented for the EF class. The configured IP SLA provides the following output on the local router.
R1#show ip sla summary
IPSLAs Latest Operation Summary
Codes: * active, ^ inactive, ~ pending

ID           Type        Destination       Stats       Return      Last
                                           (ms)        Code        Run
-----------------------------------------------------------------------
*10          icmp-echo   10.0.0.2          RTT=1       OK          0 seconds ago
ICMP Echo reaction-configuration
In the following example scenario, the ICMP Echo IP SLA reaction-configuration on SW1 triggers an SNMP trap message when the configured Round-trip time (RTT) threshold limit is exceeded. The IP SLA configured on SW1 monitors network latency between the Switch Virtual Interface (SVI) for VLAN 10 and the Server (10.0.0.1).
This is a useful test to confirm whether the latency stays within a specific threshold limit over an extended period of time. When the limit is exceeded, an SNMP trap message is sent to the SNMP Server. And when the latency is again below the defined threshold limit, an SNMP trap message is also sent. The following configuration is applied on SW1.

SW1>
SW1>enable
SW1#configure terminal
Enter configuration commands, one per line.  End with CNTL/Z.
SW1(config)#
SW1(config)#ip sla 10
SW1(config-ip-sla)#icmp-echo 10.0.0.1 source-interface Vlan10
SW1(config-ip-sla-echo)#threshold 1000
SW1(config-ip-sla-echo)#timeout 1000
SW1(config-ip-sla-echo)#frequency 1
SW1(config-ip-sla-echo)#exit
SW1(config)#
SW1(config)#ip sla schedule 10 life forever start-time now
SW1(config)#ip sla reaction-configuration 10 react rtt threshold-value 150 80 threshold-type immediate action-type trapOnly
SW1(config)#ip sla logging traps
SW1(config)#
SW1(config)#snmp-server enable traps ipsla
SW1(config)#snmp-server host 192.168.2.1 version 2c EXAMPLE-COMMUNITY
SW1(config)#
SW1(config)#exit
SW1#
Configuration:
SW1
SW1#show run int vlan 10 | sec int
interface Vlan10
 description ** SVI for VLAN 10 (GW for Host) **
 ip address 192.168.1.2 255.255.255.0

SW1#show run int vlan 20 | sec int
interface Vlan20
 description ** SVI for VLAN 20 (GW for SNMP Server) **
 ip address 192.168.2.2 255.255.255.0

SW1#show run int Gi0/0 | sec int
interface GigabitEthernet0/0
 description ** trunk link to Site 1 LAN **
 switchport trunk allowed vlan 10,20
 switchport trunk encapsulation dot1q
 switchport mode trunk
 negotiation auto

SW1#show run int Gi0/1 | sec int
interface GigabitEthernet0/1
 description ** to external network **
 no switchport
 ip address 10.1.0.2 255.255.255.252
 negotiation auto

SW1#show run | sec ^ip sla
ip sla 10
 icmp-echo 10.0.0.1 source-interface Vlan10
 threshold 1000
 timeout 1000
 frequency 1
ip sla schedule 10 life forever start-time now
ip sla reaction-configuration 10 react rtt threshold-value 150 80 threshold-type immediate action-type trapOnly
ip sla logging traps

SW1#show run | sec ^snmp
snmp-server enable traps ipsla
snmp-server host 192.168.2.1 version 2c EXAMPLE-COMMUNITY

SW1#show run | sec ^ip route
ip route 0.0.0.0 0.0.0.0 10.1.0.1
The command highlighted in the above configuration instructs SW1 to send an SNMP trap message to the SNMP Server when the upper threshold limit of 150 ms is exceeded, and also when the RTT decreases below the 80 ms lower threshold limit. The following output is taken from the SNMP Server and shows what happens when the latency between SW1 and the destination Server (10.0.0.1) increases to 200ms and then decreases to 20ms.
SNMP-Server:~$ sudo tcpdump -i eth0 -T snmp dst portrange 161-162 --number
tcpdump: verbose output suppressed, use -v[v]... for full protocol decode
listening on eth0, link-type EN10MB (Ethernet), snapshot length 262144 bytes
    1  16:19:48.812928 IP 192.168.2.2.62316 > 192.168.2.1.162:  C="EXAMPLE-COMMUNITY" V2Trap(120)  system.sysUpTime.0=514283 S:1.1.4.1.0=E:cisco.9.42.2.0.3 E:cisco.9.42.1.2.1.1.3.10="" E:cisco.9.42.1.4.1.1.5.10=0a_00_00_01 E:cisco.9.42.1.2.9.1.7.10=1
    2  16:19:49.064544 IP 192.168.2.2.62316 > 192.168.2.1.162:  C="EXAMPLE-COMMUNITY" V2Trap(255)  system.sysUpTime.0=514284 S:1.1.4.1.0=E:cisco.9.42.2.0.5 E:cisco.9.42.1.2.1.1.3.10="" E:cisco.9.42.1.4.1.1.5.10=0a_00_00_01 E:cisco.9.42.1.2.19.1.2.10=1 E:cisco.9.42.1.2.19.1.10.10=1 E:cisco.9.42.1.2.19.1.9.10=203 E:cisco.9.42.1.2.19.1.5.10=150 E:cisco.9.42.1.2.19.1.6.10=80 E:cisco.9.42.1.2.2.1.33.10=00_00_00_00_00_00_00_0a_0e_24_e5_9c_03_00_00_00_9c_e5_24_0e_0e_24_e5_9c_10_0d_c8_34
    3  16:19:49.315476 IP 192.168.2.2.62316 > 192.168.2.1.162:  C="EXAMPLE-COMMUNITY" V2Trap(255)  system.sysUpTime.0=514284 S:1.1.4.1.0=E:cisco.9.42.2.0.5 E:cisco.9.42.1.2.1.1.12.10="" E:cisco.9.42.1.4.1.1.5.10=0a_00_00_01 E:cisco.9.42.1.2.19.1.2.10=1 E:cisco.9.42.1.2.19.1.10.10=1 E:cisco.9.42.1.2.19.1.9.10=203 E:cisco.9.42.1.2.19.1.5.10=150 E:cisco.9.42.1.2.19.1.6.10=80 E:cisco.9.42.1.2.2.1.33.10=00_00_00_00_00_00_00_0b_0b_62_03_88_0e_24_e5_9c_00_00_00_00_00_00_00_0a_0e_24_e5_9c
    4  16:20:10.638683 IP 192.168.2.2.62316 > 192.168.2.1.162:  C="EXAMPLE-COMMUNITY" V2Trap(123)  system.sysUpTime.0=516465 S:1.1.4.1.0=E:cisco.9.42.2.0.3 E:cisco.9.42.1.2.1.1.3.10="" E:cisco.9.42.1.4.1.1.5.10=0a_00_00_01 E:cisco.9.42.1.2.9.1.7.10.0.0.0=2
    5  16:20:10.889349 IP 192.168.2.2.62316 > 192.168.2.1.162:  C="EXAMPLE-COMMUNITY" V2Trap(254)  system.sysUpTime.0=516466 S:1.1.4.1.0=E:cisco.9.42.2.0.5 E:cisco.9.42.1.2.1.1.3.10="" E:cisco.9.42.1.4.1.1.5.10=0a_00_00_01 E:cisco.9.42.1.2.19.1.2.10=1 E:cisco.9.42.1.2.19.1.10.10=2 E:cisco.9.42.1.2.19.1.9.10=22 E:cisco.9.42.1.2.19.1.5.10=150 E:cisco.9.42.1.2.19.1.6.10=80 E:cisco.9.42.1.2.2.1.33.10=00_00_00_00_00_00_00_0a_0e_24_e5_9c_07_00_00_00_9c_e5_24_0e_0e_24_e5_9c_10_0d_c8_34
    6  16:20:11.140332 IP 192.168.2.2.62316 > 192.168.2.1.162:  C="EXAMPLE-COMMUNITY" V2Trap(254)  system.sysUpTime.0=516466 S:1.1.4.1.0=E:cisco.9.42.2.0.5 E:cisco.9.42.1.2.1.1.12.10="" E:cisco.9.42.1.4.1.1.5.10=0a_00_00_01 E:cisco.9.42.1.2.19.1.2.10=1 E:cisco.9.42.1.2.19.1.10.10=2 E:cisco.9.42.1.2.19.1.9.10=22 E:cisco.9.42.1.2.19.1.5.10=150 E:cisco.9.42.1.2.19.1.6.10=80 E:cisco.9.42.1.2.2.1.33.10=00_00_00_00_00_00_00_0b_0b_62_03_88_0e_24_e5_9c_00_00_00_00_00_00_00_0a_0e_24_e5_9c
^C
6 packets captured
6 packets received by filter
0 packets dropped by kernel
In the above TCPDUMP output the first three SNMP messages are received when the RTT increases to 200ms, and the remaining three messages are received when the RTT returns to 20ms. The included numeric values are Management Information Base (MIB) Object Identifiers (OID) that can be translated and graphically displayed by a network monitoring software.
The following outputs are taken from SW1 showing the SNMP activity, and also the statistics about the IP SLA. It is visible that SNMP trap messages have been sent by SW1. Further, the switch logs also indicate that the IP SLA RTT reaction threshold was exceeded.
SW1#show snmp | sec packets output
48 SNMP packets output
    0 Too big errors (Maximum packet size 1500)
    0 No such name errors
    0 Bad values errors
    0 General errors
    0 Response PDUs
    48 Trap PDUs


SW1#show log | beg Log Buffer
Log Buffer (8192 bytes):

%RTT-3-IPSLATHRESHOLD: IP SLAs(10): Threshold occurred for rtt
%RTT-3-IPSLATHRESHOLD: IP SLAs(10): Threshold exceeded for rtt
%RTT-3-IPSLATHRESHOLD: IP SLAs(10): Threshold cleared for rtt
%RTT-3-IPSLATHRESHOLD: IP SLAs(10): Threshold below for rtt


SW1#show ip sla reaction-configuration
Entry number: 10
Index: 1
Reaction: rtt
Threshold Type: Immediate
Rising (milliseconds): 150
Falling (milliseconds): 80
Action Type: Trap only


SW1#show ip sla summary
IPSLAs Latest Operation Summary
Codes: * active, ^ inactive, ~ pending

ID           Type        Destination       Stats       Return      Last
                                           (ms)        Code        Run
-----------------------------------------------------------------------
*10          icmp-echo   10.0.0.1          RTT=22      OK          0 seconds ago
IP SLA FTP configuration
In this example scenario, an IP SLA FTP on R1 is configured together with object tracking. The IP SLA on R1 attempts to reach the file "IP-SLA-Test-File.txt" on the FTP Server. Thus, the IP SLA monitors that the file is present at the specific location. If the file cannot be reached for any reason, then the IP SLA's state is down and automated actions can be taken to mitigate any impact for processes that rely on that file.

Configuration:
R1
R1#show run | sec ip sla
ip sla 10
 ftp get ftp://FTP-UserAccount:p4ssw0rd@192.168.0.94/IP-SLA-Test-File.txt
 frequency 30
ip sla schedule 10 life forever start-time now

R1#show run | sec track
track 1 ip sla 10
Below, viewing the IP SLA and track object statistics on R1, and NAT translations on R2:
R1#show ip sla statistics
IPSLAs Latest Operation Statistics

IPSLA operation id: 10
        Latest RTT: 453 milliseconds
Latest operation start time: 19:20:53 UTC Mon Aug 29 2022
Latest operation return code: OK                             « File is reachable on the FTP Server
Number of successes: 6
Number of failures: 0
Operation time to live: Forever


R1#show track 1
Track 1
  IP SLA 10 state
  State is Up                                                « Tracked object is Up
    1 change, last change 00:01:10
  Latest operation return code: OK
  Latest RTT (millisecs) 427


R2#show ip nat tra
Pro Inside global      Inside local       Outside local      Outside global
tcp 192.168.0.62:15646 172.16.1.2:15646   192.168.0.94:21    192.168.0.94:21  « FTP TCP port number 21
tcp 192.168.0.62:38449 172.16.1.2:38449   192.168.0.94:21    192.168.0.94:21
tcp 192.168.0.62:42082 172.16.1.2:42082   192.168.0.94:60027 192.168.0.94:60027
tcp 192.168.0.62:55965 172.16.1.2:55965   192.168.0.94:33584 192.168.0.94:33584
If needed, the file can be downloaded from the FTP Server to R1, and opened with the following commands.
R1#copy ftp://FTP-UserAccount:p4ssw0rd@192.168.0.94/IP-SLA-Test-File.txt flash:
Destination filename [IP-SLA-Test-File.txt]?
Accessing ftp://*:*@192.168.0.94/IP-SLA-Test-File.txt...
Loading IP-SLA-Test-File.txt
[OK - 93/4096 bytes]

93 bytes copied in 1.484 secs (63 bytes/sec)

R1#more flash:IP-SLA-Test-File.txt
This is a test file for IP SLA FTP.
An IP SLA is created to check reachability of this file.

R1#
To setup this lab scenario, an FTP Server running very secure FTP daemon (vsftpd) is installed on an Ubuntu virtual machine.
IP SLA TCP-Connect configuration
In this example, a TCP-Connect IP SLA is configured on R1 to monitor connectivity for TCP port 3000 on the Server. This means, the IP SLA can monitor the availability of a specific service on the destination device, or verify that connection to the particular TCP port are allowed to pass through the network. The Server is running an IP SLA responder listening on TCP port 3000.

Configuration:
R1
R1#show run | sec ^ip sla
ip sla 10
 tcp-connect 10.2.0.2 3000 source-ip 10.1.0.1 control disable
 threshold 1000
 timeout 1000
 frequency 1
ip sla schedule 10 life forever start-time now
Server
Server#show run | sec ^ip sla
ip sla responder tcp-connect port 3000
Server#show control-plane host open-ports
Active internet connections (servers and established)
Prot               Local Address             Foreign Address                  Service    State
 tcp                        *:23                         *:0                   Telnet   LISTEN
 tcp                      *:3000                         *:0        IP SLAs Responder   LISTEN       « Server listening on TCP port 3000
 tcp                      *:3000                         *:0        IP SLAs Responder   LISTEN


Server#show tcp brief
TCB       Local Address               Foreign Address             (state)
0F3136D8  10.2.0.2.3000              10.1.0.1.42128              TIMEWAIT    « Successful connection from IP SLA on R1
10BB7AC8  10.2.0.2.3000              10.1.0.1.28966              TIMEWAIT
10BB81C8  10.2.0.2.3000              10.1.0.1.55501              TIMEWAIT
0D38A080  10.2.0.2.3000              10.1.0.1.31069              TIMEWAIT
10EFCDE8  10.2.0.2.3000              10.1.0.1.51078              TIMEWAIT
10216D20  10.2.0.2.3000              10.1.0.1.40579              TIMEWAIT
0F313DD8  10.2.0.2.3000              10.1.0.1.48040              TIMEWAIT
0D312940  10.2.0.2.3000              10.1.0.1.60462              TIMEWAIT
1086A0A0  10.2.0.2.3000              10.1.0.1.53859              TIMEWAIT


R1#show ip sla statistics details
IPSLAs Latest Operation Statistics

IPSLA operation id: 10
        Latest RTT: 46 milliseconds
Latest operation start time: 16:02:23 UTC Fri Jan 19 2024
Latest operation return code: OK
Over thresholds occurred: FALSE
Number of successes: 402
Number of failures: 0
Operation time to live: Forever
Operational state of entry: Active
Last time this entry was reset: Never
Alternatively, the Server can run iPerf in server mode listening on TCP port 3000, as shown below. The TCP-Connect IP SLA will successfully establish a TCP connection.
Server:~$ iperf -s -p 3000
------------------------------------------------------------
Server listening on TCP port 3000
TCP window size:  128 KByte (default)
------------------------------------------------------------
[  0] local 10.2.0.2 port 3000 connected with 10.1.0.1 port 29488     « Successful connections from IP SLA on R1
[  0] local 10.2.0.2 port 3000 connected with 10.1.0.1 port 27569
[  0] local 10.2.0.2 port 3000 connected with 10.1.0.1 port 13826
[  0] local 10.2.0.2 port 3000 connected with 10.1.0.1 port 26363
[  0] local 10.2.0.2 port 3000 connected with 10.1.0.1 port 26703
[  0] local 10.2.0.2 port 3000 connected with 10.1.0.1 port 29366


R1#show ip sla summary
IPSLAs Latest Operation Summary
Codes: * active, ^ inactive, ~ pending

ID           Type        Destination       Stats       Return      Last
                                           (ms)        Code        Run
-----------------------------------------------------------------------
*10          tcp-connect 10.2.0.2          RTT=45      OK          0 seconds ago
IP SLA UDP-Jitter configuration
In the following example, a UDP-Jitter IP SLA is configured between R1 and the Server. This type of test is specifically useful for monitoring or benchmarking of networks for voice applications, either in troubleshooting or when preparing for deployment. In this scenario the audio compression algorithm G.729 is used to simulate VoIP traffic from R1 to the Server.
The following router output shows a variety of information, such as the mean opinion score (MOS) which provides insights about the audio quality.
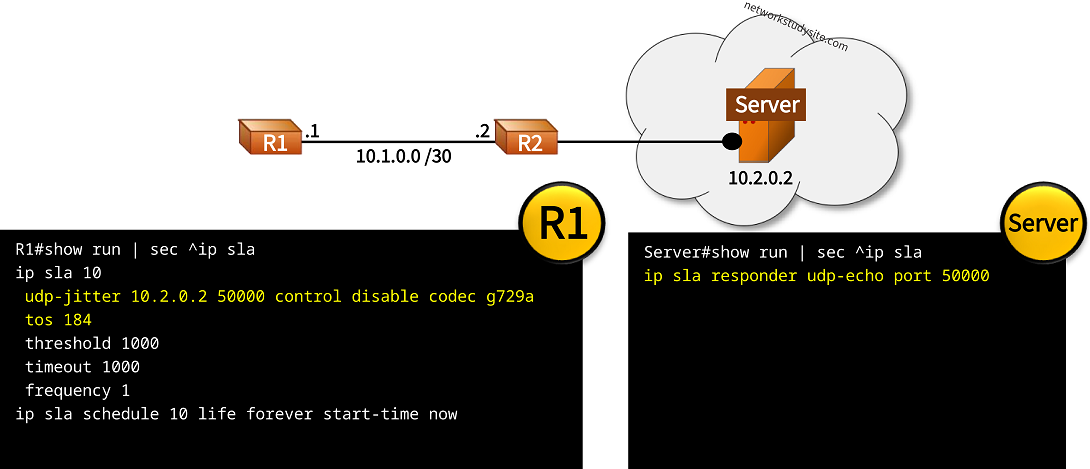
Configuration:
R1
R1#show run | sec ^ip sla
ip sla 10
 udp-jitter 10.2.0.2 50000 control disable codec g729a
 tos 184
 threshold 1000
 timeout 1000
 frequency 1
ip sla schedule 10 life forever start-time now
Server
Server#show run | sec ^ip sla
ip sla responder udp-echo port 50000
R1#show ip sla statistics
IPSLAs Latest Operation Statistics

IPSLA operation id: 10
Type of operation: udp-jitter
        Latest RTT: 421 milliseconds
Latest operation start time: 16:39:59 UTC Fri Jan 19 2024
Latest operation return code: OK
RTT Values:
        Number Of RTT: 812              RTT Min/Avg/Max: 1/421/744 milliseconds
Latency one-way time:
        Number of Latency one-way Samples: 0
        Source to Destination Latency one way Min/Avg/Max: 0/0/0 milliseconds
        Destination to Source Latency one way Min/Avg/Max: 0/0/0 milliseconds
Jitter Time:
        Number of SD Jitter Samples: 0
        Number of DS Jitter Samples: 0
        Source to Destination Jitter Min/Avg/Max: 0/0/0 milliseconds
        Destination to Source Jitter Min/Avg/Max: 0/0/0 milliseconds
Over Threshold:
        Number Of RTT Over Threshold: 0 (0%)
Packet Loss Values:
        Loss Source to Destination: 0
        Source to Destination Loss Periods Number: 0
        Source to Destination Loss Period Length Min/Max: 0/0
        Source to Destination Inter Loss Period Length Min/Max: 0/0
        Loss Destination to Source: 0
        Destination to Source Loss Periods Number: 0
        Destination to Source Loss Period Length Min/Max: 0/0
        Destination to Source Inter Loss Period Length Min/Max: 0/0
        Out Of Sequence: 0      Tail Drop: 0
        Packet Late Arrival: 0  Packet Skipped: 0
Voice Score Values:
        Calculated Planning Impairment Factor (ICPIF): 24
        MOS score: 3.55
Number of successes: 46
Number of failures: 0
Operation time to live: Forever
IP SLA HTTP Get configuration
In the following example, an HTTP GET IP SLA is configured on R1 monitoring the connectivity to port 80 on Server1. The source IP address of the IP SLA is 192.168.1.1 which is the default gateway IP address for clients in Site 1. The DNS Server resolves the hostname "Server1" to the IP address 192.168.2.3 of the HTTP server.

Configuration:
R1
R1#show run | sec ip sla
ip sla 10
 http get http://Server1:80 source-ip 192.168.1.1
ip sla schedule 10 life forever start-time now

R1#show run all | sec ip domain lookup$
 ip domain lookup

R1#show run all | sec name-server
ip name-server 10.0.0.2
DNS-Server
DNS-Server#show run | sec dns
ip dns server

DNS-Server#show run | sec ip host
ip host Server1 192.168.2.3
Server1
Server1#show run | sec ip http
ip http server
ip http authentication local
ip http secure-server
DNS-Server#show hosts
Default domain is not set
Name/address lookup uses domain service
Name servers are 255.255.255.255

Codes: UN - unknown, EX - expired, OK - OK, ?? - revalidate
       temp - temporary, perm - permanent
       NA - Not Applicable None - Not defined

Host                      Port  Flags      Age Type   Address(es)
Server1                   None  (perm, OK)  0   IP    192.168.2.3    « DNS binding


Server1#show ip http server status | i server status|port:
HTTP server status: Enabled
HTTP server port: 80       « HTTP server enabled
HTTP secure server status: Enabled
HTTP secure server port: 443


R1(config)#do show ip sla config
IP SLAs Infrastructure Engine-III
Entry number: 10                                        « IP SLA 10
Type of operation to perform: http
Target address/Source address: 192.168.2.3/192.168.1.1  « Destination/Source address
Target port/Source port: 80/0                           « Port number
Type Of Service parameters: 0x0
Vrf Name:
HTTP Operation: get
HTTP Server Version: 1.0
URL: http://Server1:80     « URL
Proxy:
Raw String(s):
Cache Control: enable
Owner:
Tag:
Operation timeout (milliseconds): 60000
Schedule:
   Operation frequency (seconds): 60  (not considered if randomly scheduled)  « Frequency
   Next Scheduled Start Time: Start Time already passed
   Group Scheduled : FALSE
   Randomly Scheduled : FALSE
   Life (seconds): Forever
   Entry Ageout (seconds): never
   Recurring (Starting Everyday): FALSE
   Status of entry (SNMP RowStatus): Active
Threshold (milliseconds): 5000
Distribution Statistics:
   Number of statistic hours kept: 2
   Number of statistic distribution buckets kept: 1
   Statistic distribution interval (milliseconds): 20
History Statistics:
   Number of history Lives kept: 0
   Number of history Buckets kept: 15
   History Filter Type: None


R1#show ip sla statistics
IPSLAs Latest Operation Statistics

IPSLA operation id: 10
        Latest RTT: 133 milliseconds
Latest operation start time: 12:47:10 UTC Wed Aug 31 2022
Latest operation return code: OK   « Connection okay
Latest DNS RTT: 41 ms
Latest TCP Connection RTT: 44 ms
Latest HTTP Transaction RTT: 48 ms
Number of successes: 24
Number of failures: 0
Operation time to live: Forever
IP SLA DNS configuration
In this scenario, a DNS IP SLA is configured on R1 monitoring the connectivity to the DNS Server by resolving the hostname "Server1". The source IP address of the IP SLA is 192.168.1.1 which is the default gateway address of clients in Site 1.

Configuration:
R1
R1#show run | sec ip sla
ip sla 10
 dns Server1 name-server 10.0.0.2 source-ip 192.168.1.1
 frequency 9
ip sla schedule 10 life forever start-time now

R1#show run all | sec ip domain lookup$
 ip domain lookup

R1#show run all | sec name-server
ip name-server 10.0.0.2
DNS-Server
DNS-Server#show run | sec dns
ip dns server

DNS-Server#show run | sec ip host
ip host Server1 192.168.2.3
R1#show ip sla statistics
IPSLAs Latest Operation Statistics

IPSLA operation id: 10
        Latest RTT: 47 milliseconds
Latest operation start time: 12:55:52 UTC Wed Aug 31 2022
Latest operation return code: OK   « Connection okay, name resolution works
Number of successes: 22
Number of failures: 0
Operation time to live: Forever